
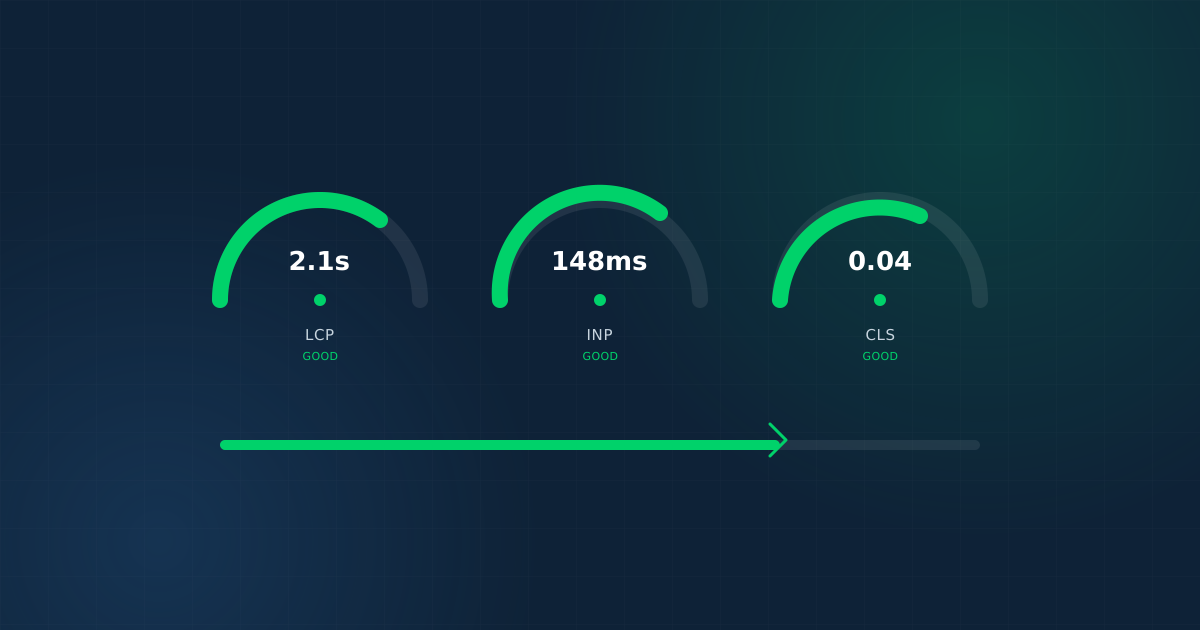
Run a site through a performance testing tool and the report can look alarming — dozens of flagged issues, unfamiliar acronyms, scores in red. In practice, most sites fail Core Web Vitals for two or three specific, well-understood reasons.
Run a site through a performance testing tool and the report can look alarming — dozens of flagged issues, unfamiliar acronyms, scores in red. In practice, the overwhelming majority of sites fail Core Web Vitals for two or three specific, well-understood reasons, not fifty different ones. The report looks complicated; the fix usually isn't.
What Core Web Vitals Actually Measure
Largest Contentful Paint (LCP) measures how long it takes for the main content of a page — usually a hero image or headline block — to become visible. This is what most people mean when they say a site "feels slow."
Interaction to Next Paint (INP) measures how responsive a page feels when a user actually interacts with it — clicking a button, opening a menu — and how long it takes for the page to visibly respond.
Cumulative Layout Shift (CLS) measures visual stability — whether elements jump around as a page loads, like a button shifting position right as someone tries to click it.
Google treats all three as real-world signals of user experience, not synthetic lab benchmarks, which is part of why they carry weight in ranking and, more directly, in whether visitors stay or leave.
Do These Actually Affect Rankings?
Yes, but with an important caveat: Core Web Vitals are a confirmed ranking factor, generally weighted less heavily than content relevance and quality. A page with excellent Core Web Vitals scores and thin, irrelevant content will not outrank a slower page with genuinely better content. Where Core Web Vitals matter most in practice isn't the ranking algorithm — it's user behavior. Slow, unstable pages measurably increase bounce rates and reduce conversions, which then indirectly affects rankings through engagement signals anyway.
The Handful of Issues Behind Most Failing Scores
Unoptimized images. This is, by a wide margin, the most common cause of poor LCP. Large, uncompressed images — especially hero images loading above the fold — directly delay when the main content becomes visible. Modern formats (WebP, AVIF) and proper compression typically cut image weight substantially without visible quality loss.
Render-blocking CSS and JavaScript. When large stylesheets or scripts must fully load and execute before the browser can paint content, LCP suffers even on a fast connection. Deferring non-critical scripts and inlining critical CSS addresses most of this.
Excessive third-party scripts. Chat widgets, analytics tags, ad scripts, and tracking pixels each add their own loading and execution time. It's common to find five or six third-party scripts on a page where only two are actually still in use.
Layout shifts from unset dimensions. Images and embeds without explicit width and height attributes cause the page to reflow as they load, driving up CLS. This is usually one of the cheapest fixes available with one of the most noticeable effects on perceived quality.
Unresponsive interaction handlers. Poor INP scores usually trace back to heavy JavaScript execution blocking the main thread right when a user clicks or taps something — the fix is typically breaking up long-running scripts rather than removing functionality.
A Practical Fix Priority Order
- Compress and modernize images first. This single fix resolves LCP issues on a large share of underperforming sites, and it's usually the fastest to implement.
- Defer non-critical JavaScript and inline critical CSS. Addresses the second most common LCP bottleneck.
- Audit and remove unused third-party scripts. Often an easy win that also improves INP.
- Set explicit dimensions on images and embeds. Cheap, fast, and directly targets CLS.
- Implement caching and a CDN if not already in place. Improves load time globally, especially for visitors far from the origin server.
- Re-test and address remaining issues individually, rather than trying to fix everything the first report flags at once.
What Not to Over-Invest In
Chasing a perfect 100 score across every metric usually produces diminishing returns past a certain point. Once a site sits comfortably in Google's "Good" thresholds across LCP, INP, and CLS, further micro-optimization tends to matter far less than continuing to invest in content, structure, and conversion design. Speed is a threshold to clear, not a competition to win outright.
How to Check Where Your Site Stands
Google's PageSpeed Insights and Search Console's Core Web Vitals report both use real-world field data where available, which is more representative of actual user experience than lab-only testing tools. Checking both — and checking mobile and desktop separately, since they're scored independently — gives a more complete picture than a single test run.
The Bottom Line
Core Web Vitals problems look complicated in a report and are usually simple in practice: unoptimized images, render-blocking scripts, unnecessary third-party tags, and unset element dimensions account for most failing scores. Fixing those four things, in that order, resolves the majority of performance issues without needing to chase every flagged item a testing tool surfaces.
Speed is one layer of visibility — it's worth pairing with AI search optimization and a well-built web platform underneath it, so the traffic a fast site earns actually has somewhere solid to land.